A Full-service Digital Research Environment for Ecotoxicology
Ecotoxicology researchers carry out complex, team-shared activities involving
- Data: collection, organization, preservation and integration
- Tools: writing and executing statistical models and computational software
- Exploration: navigation, search and visualization of data and tool output
- Analytics: synthesis of results to produce conclusions.
 offers a powerful solution -- a platform where your data, computing and scientific workflows come together in datasets that you build, use and share across your entire investigation. DEEDS offers a full-service research environment for team-shared data, computing, and analytics, with built-in data provenance, reproducibility, exploration, visualization, and FAIR-compliant publication for reuse. [1][2][3] To find out more about DEEDS, contact Ann Christine Catlin
acc@purdue.edu
offers a powerful solution -- a platform where your data, computing and scientific workflows come together in datasets that you build, use and share across your entire investigation. DEEDS offers a full-service research environment for team-shared data, computing, and analytics, with built-in data provenance, reproducibility, exploration, visualization, and FAIR-compliant publication for reuse. [1][2][3] To find out more about DEEDS, contact Ann Christine Catlin
acc@purdue.edu
Technology Transfer All "EcoTox" datasets created on the DEEDS platform for the Strategic Environmental Research and Development Program will be published with DOI for public access and use. The published datasets will make all data, statistical tools, and results collected, used, and produced through the EcoTox project fully available for research, education and practice.
Tour of EcoTox DEEDS datasets
Members of the EcoTox project [4] are creating DEEDS datasets to support their team-shared research investigations. EcoTox projects focus on evaluating the ecological risk posed by per- and polyfluorinated alkyl substances (PFAS). PFAS are a group of contaminants of emerging concern that are slow to break down in the environment, frequently detected in water, soil, animal and human tissues, and can adversely affect the health of humans and wildlife.There is great interest in understanding PFAS toxicity from both ecological and public health perspectives, and many parties stand to benefit from their data, including academics, regulators, policymakers, and ultimately, the general public. Scroll down to see how DEEDS features and capabilities support the EcoTox workflows, data and tools during their investigations, followed by publication for use and reuse in research, education and practice when the investigation is complete.
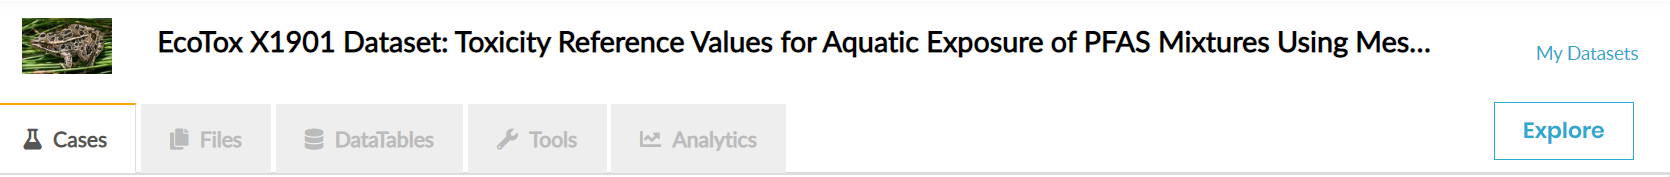
| An interactive dashboard manages our shared research activities through a sequence of tabs that connect Cases (organization of experimental units), Files (repository management), DataTables (management of spreadsheet-based data models), Tools (computing services and workflows) and Analytics (built-in ad hoc analysis). |
|
DEEDS supports our internal workflows by providing a link between the raw data we upload to the platform and the tools we use to process and analyze the raw data.
DEEDS assigns comprehensive metadata and provides interactive exploration services for data, tools and workflows so that interested parties can understand and reproduce our work. Using DEEDS allows us to better serve other stakeholders by ensuring the quality, integrity, transparency, and accessibility of the data we collect. |
|
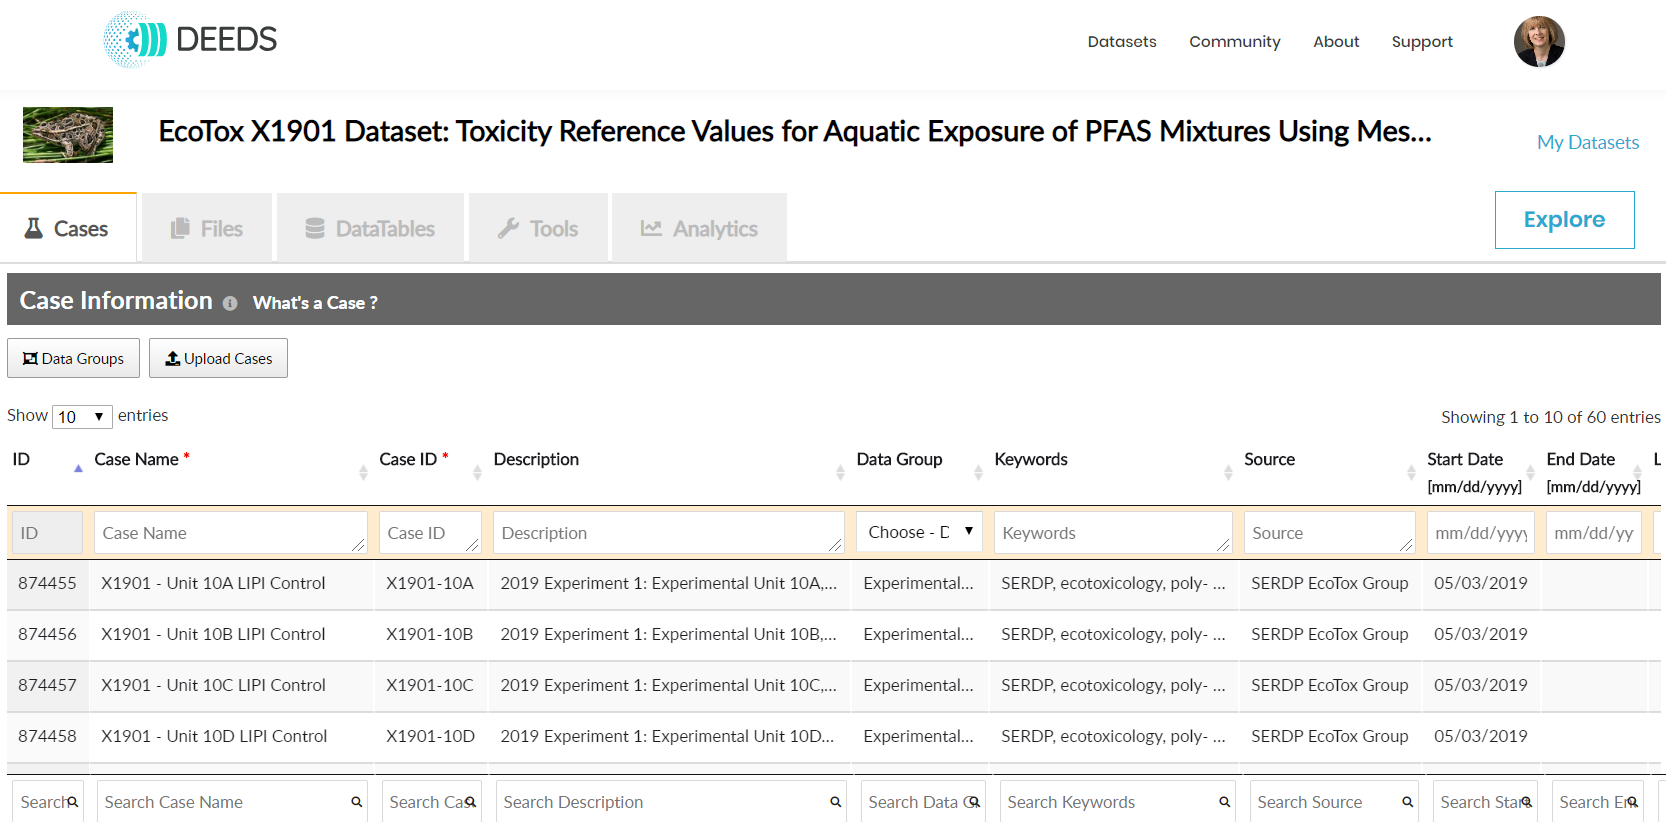
Our dataset cases represent experimental units or aquaria, defined by study properties such as animal species, chemical, and concentration. Dataset files, data tables, tools, tool executions, results and analytics are directly connected to these cases.
Cases and their metadata can be entered and updated interactively in DEEDS and can also be uploaded and updated in DEEDS via spreadsheets. |
|
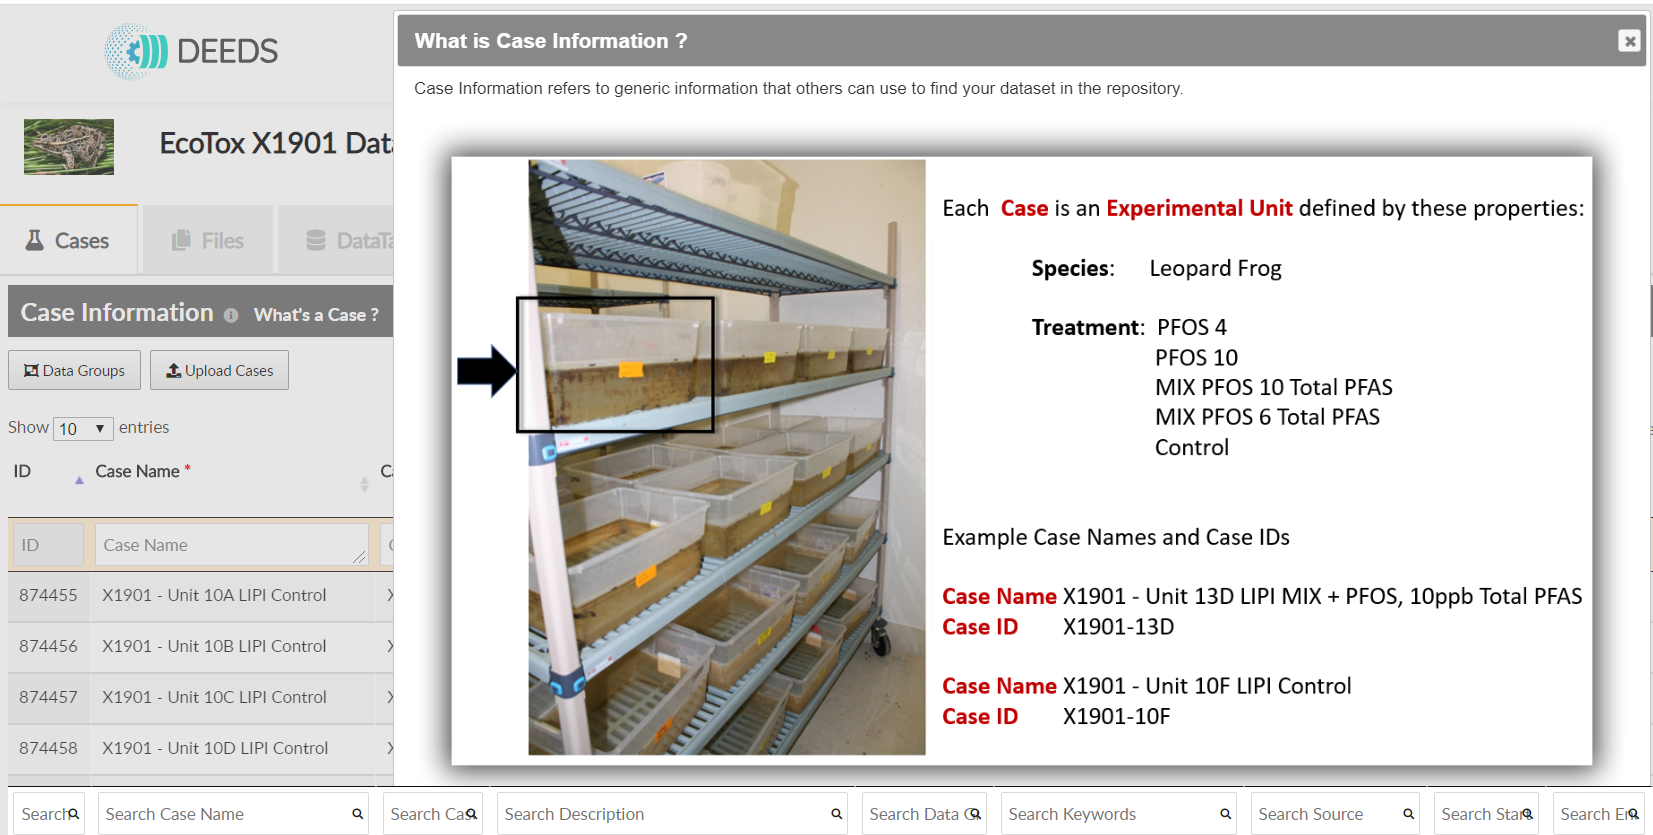
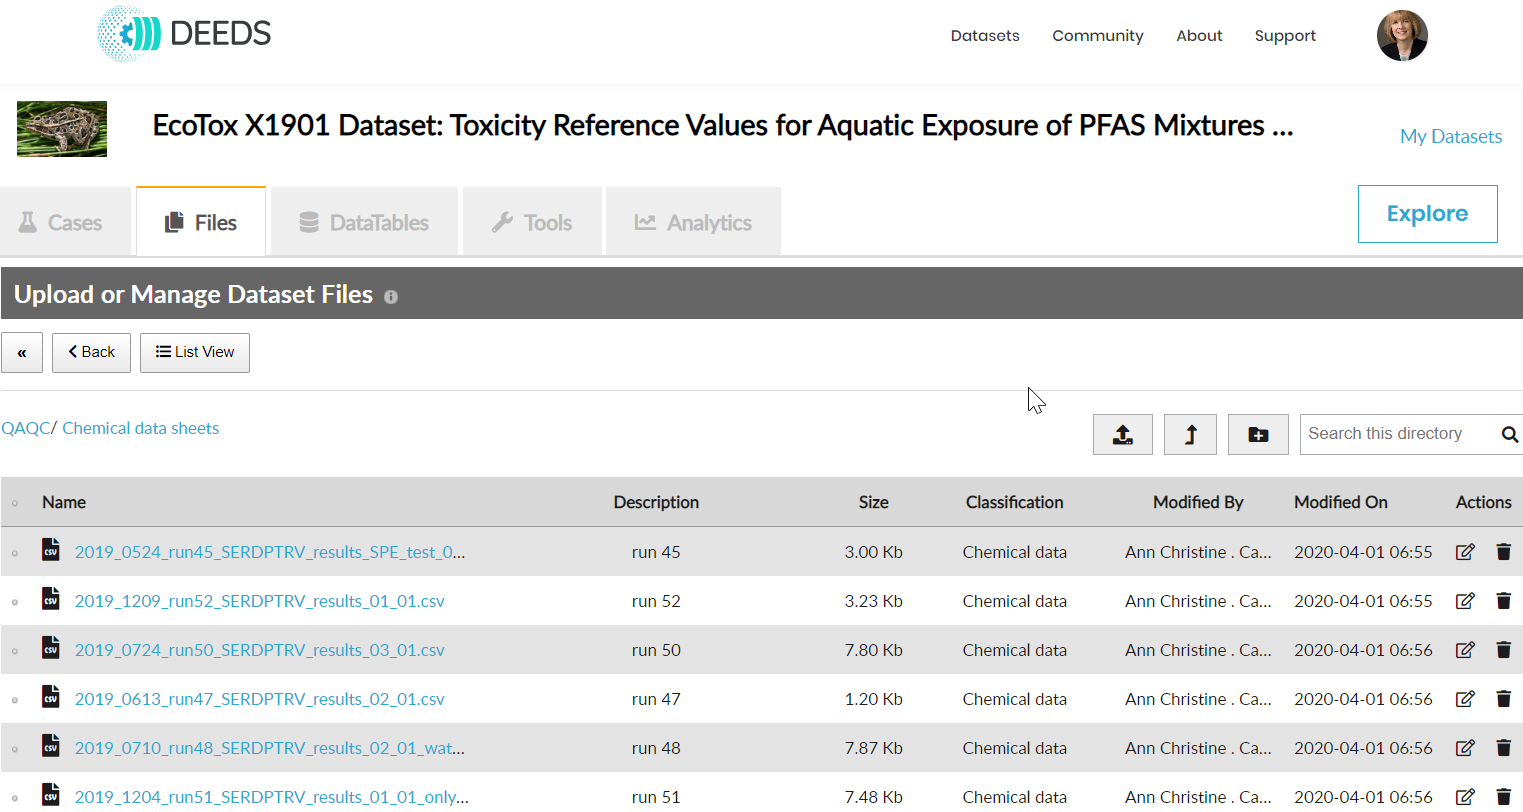
All files associated with our cases-- such as protocols, scanned datasheets and control forms, standard operating procedures, and husbandry records -- are uploaded, classified and annotated with substantial metadata.
Raw data collection spreadsheets and raw measurement files generated by mass spectrometry instruments are also uploaded. These raw data files are processed by DEEDS pipeline scripts for transformation to interactive, searchable DEEDS data tables. All raw data files, pipeline tools, and transformation workflows are preserved for data provenance and results traceability. |

| The DEEDS file repository is rich in features, such as Custom category creation; File extension validation; Notifications for uploads so that workflows can be managed effectively; SFTP uploads for very large files or large numbers of files; Automatic metadata extraction; Case-based files, case-shared files and dataset-based files; File classification and annotation to support repository search. |
| |
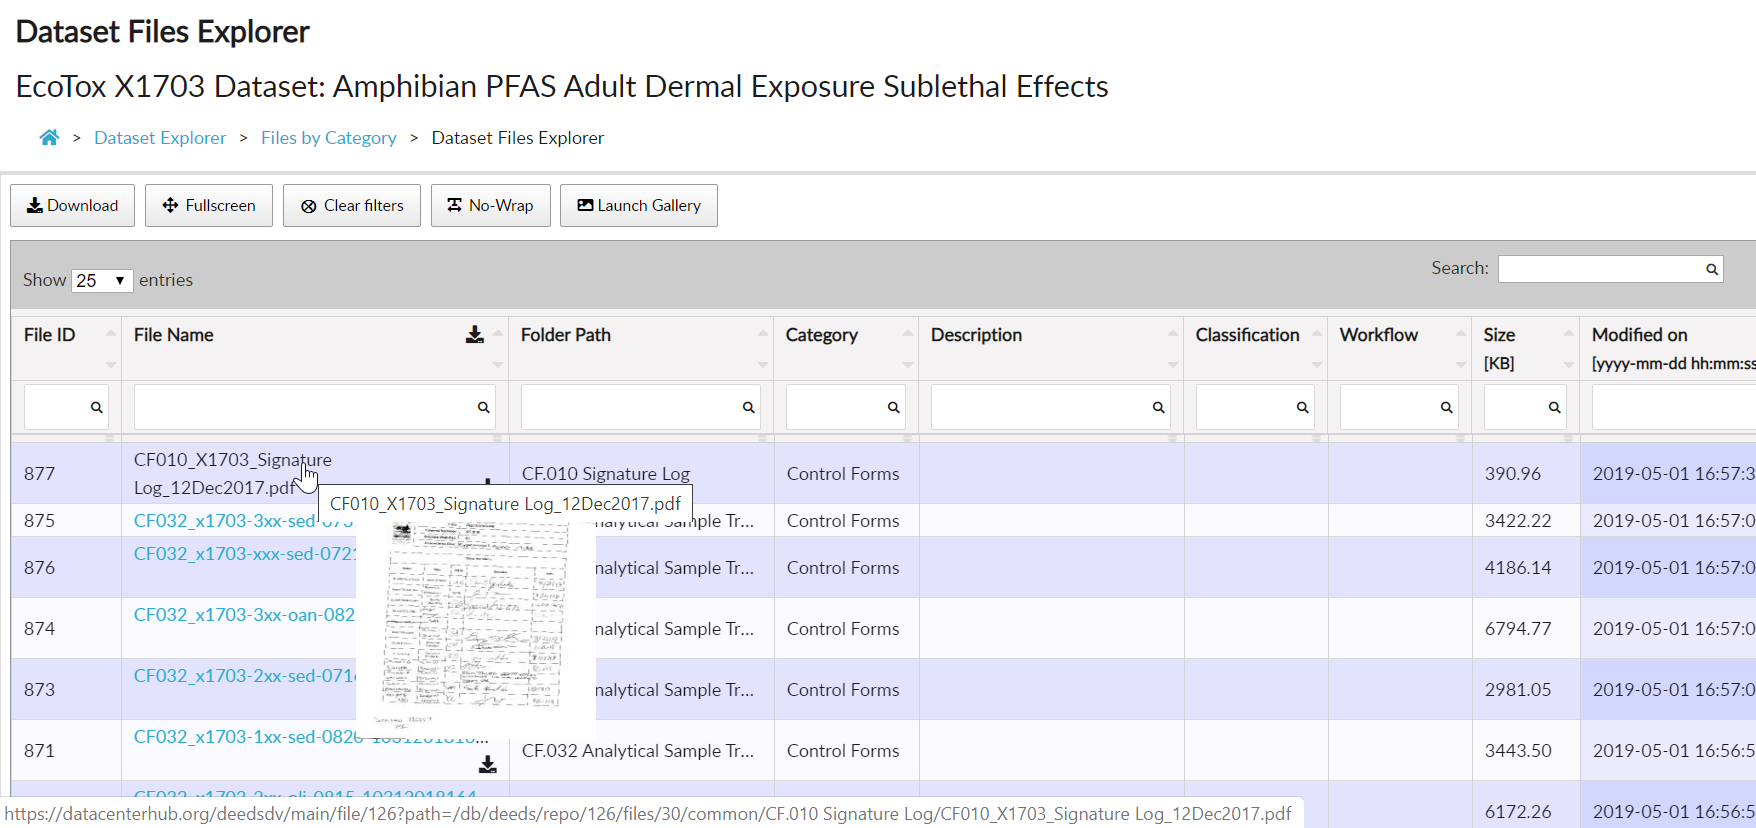
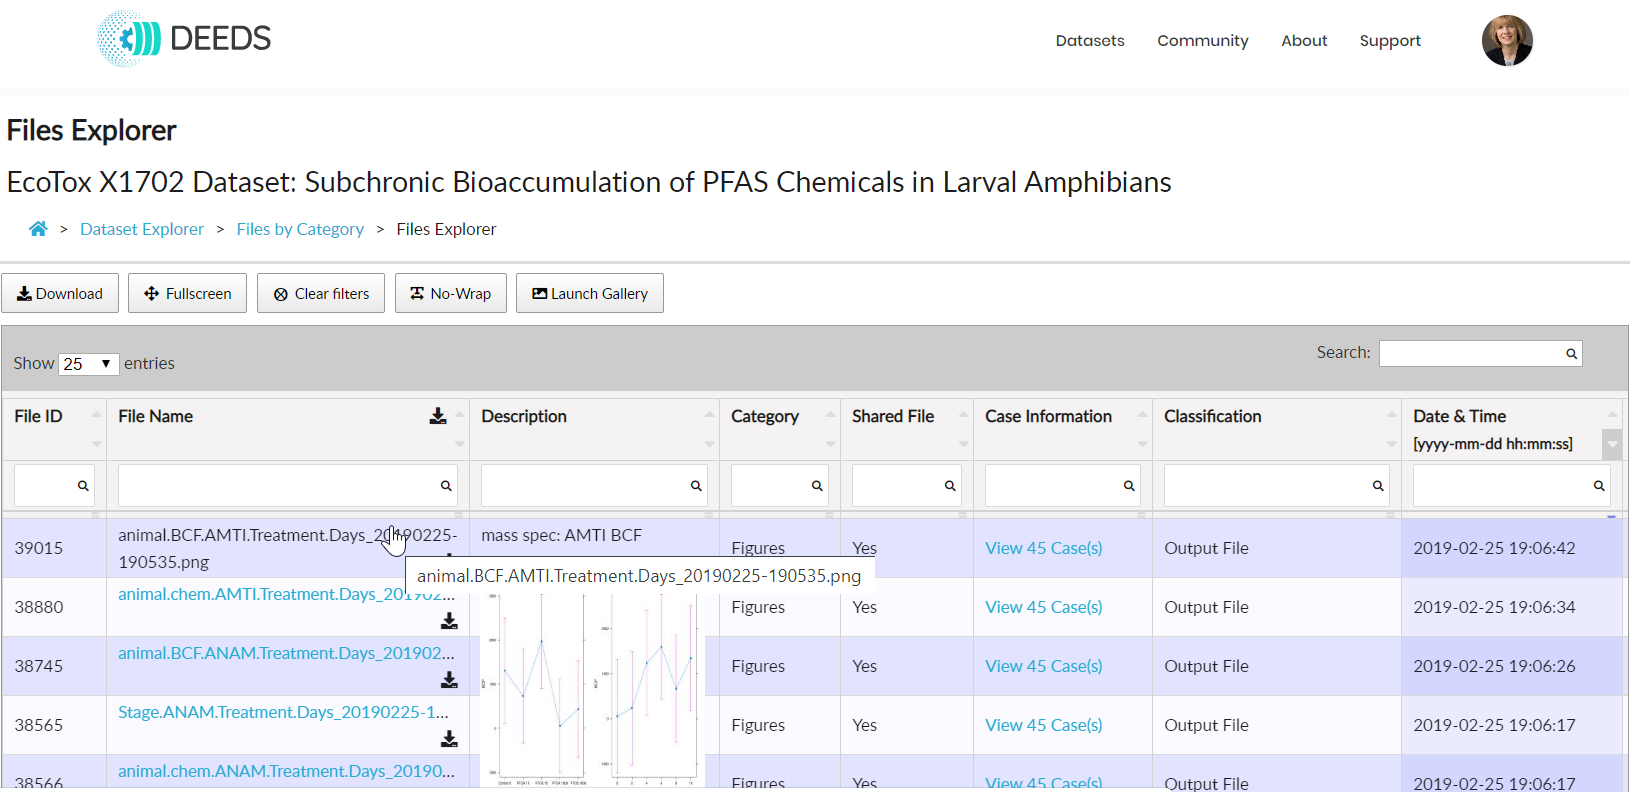
| Our DEEDS file repository can be readily accessed and viewed from this top-level dataset Explorer display. Files are presented by category and can be filtered and searched by classification and description metadata. Interactive viewing and visualization applications are attached to file categories, such as media gallery viewing for video and image files. In the dataset Explorer, files can be filtered, viewed, searched and compared within and across cases. |
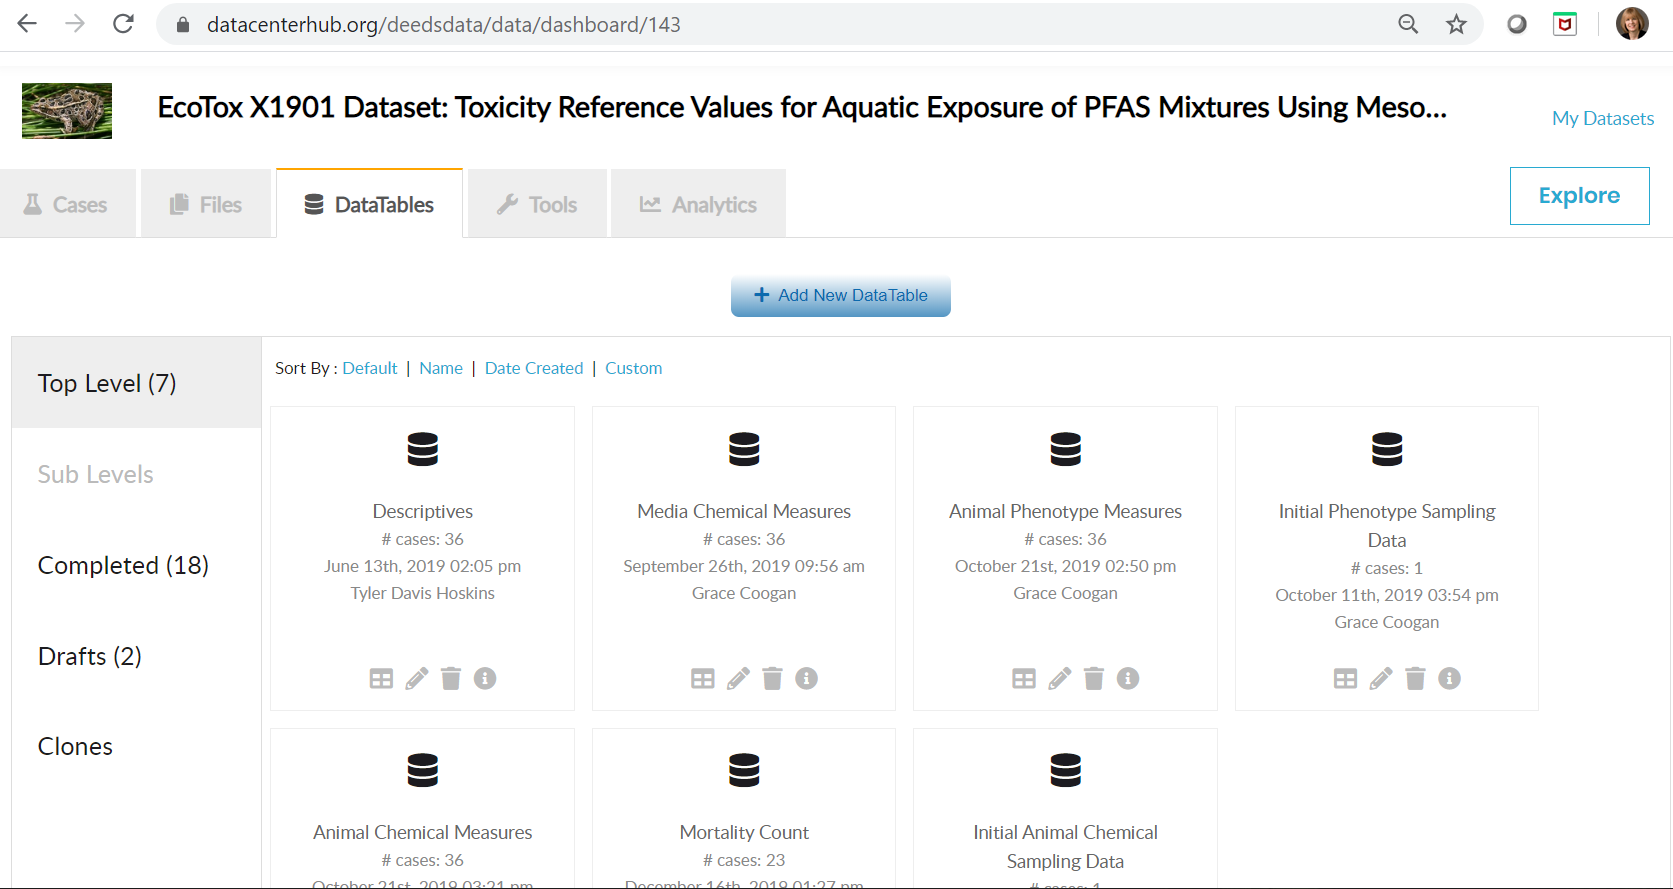
| Observations of endpoints from each experimental unit are recorded at different time points. From the top-level, each case is directly linked to a hierarchy of tables containing all data collected for various endpoints and at various phases of our study. These endpoints are divided into ‘phenotypic’ and ‘chemical’ data tables. Phenotypic data were always collected at the individual level, while chemical data can represent either a single individual or a pooled sample containing multiple individuals when individual masses were too small for analysis. Additionally, we also collected chemical data quantifying levels of PFAS in the media (i.e. water) of each aquaria to ensure the quality of the data and improve transparency. Phenotypic, animal chemical, and media chemical datasets are all further structured by sampling date. |
|
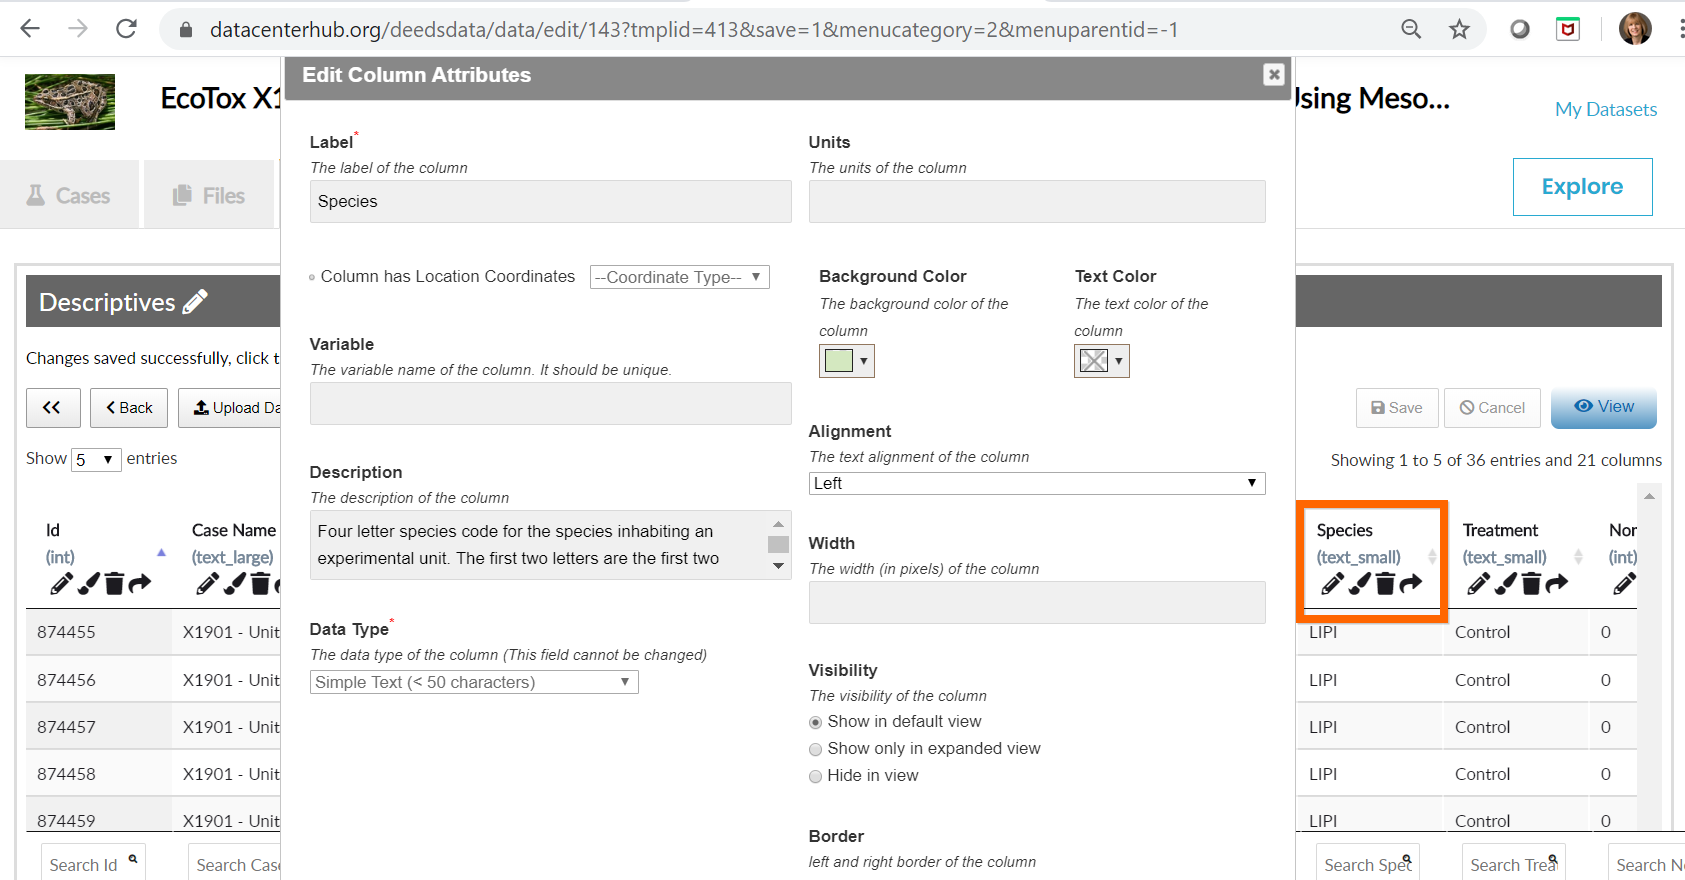
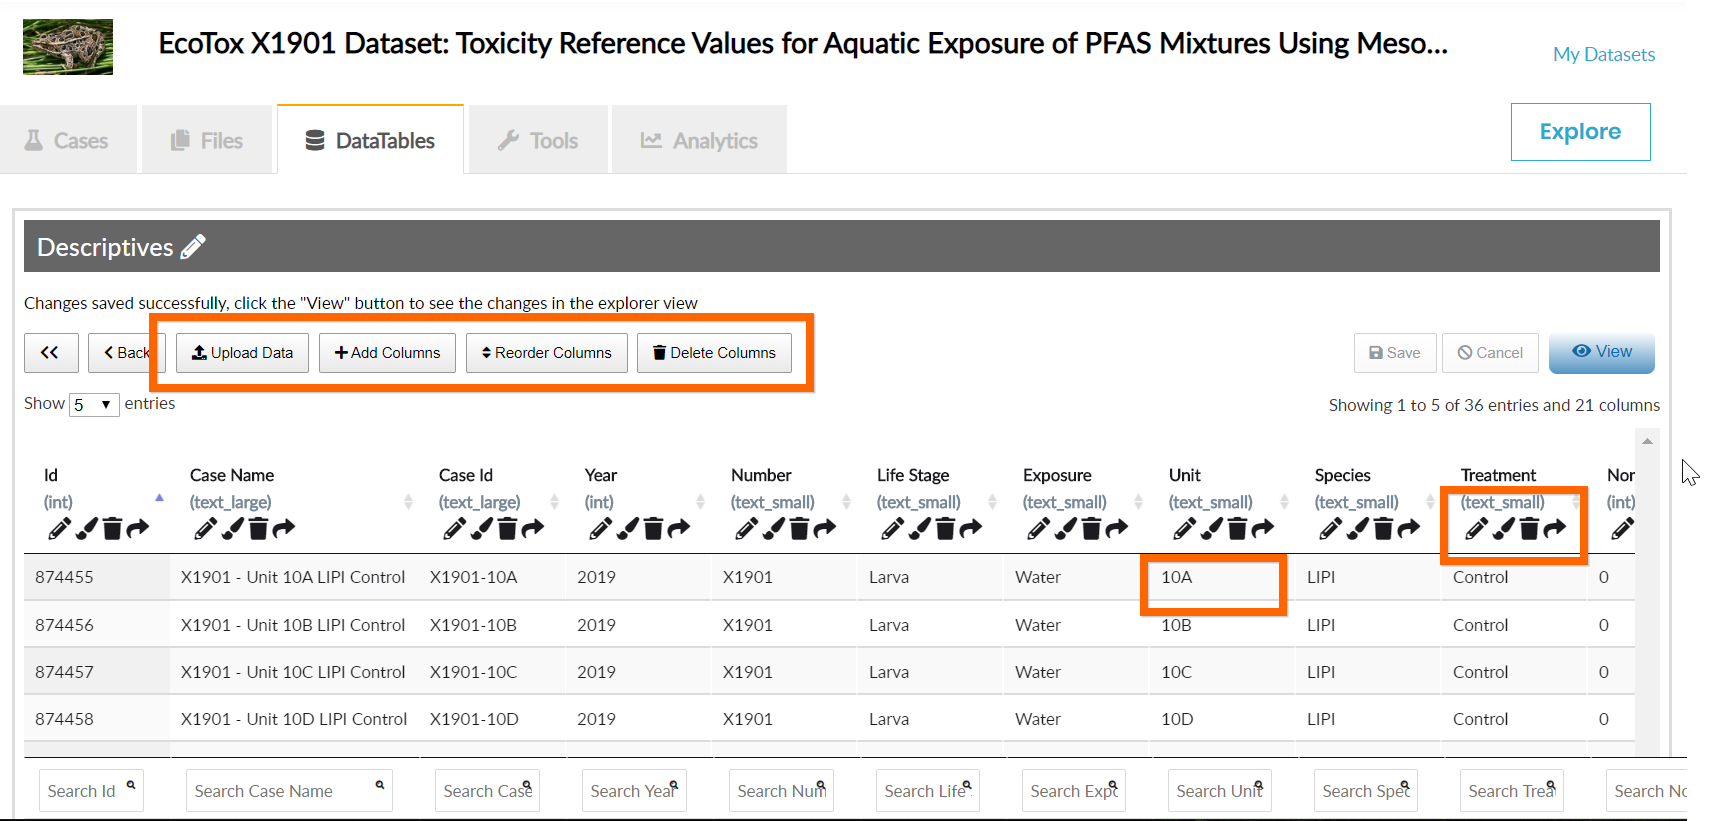
Data tables are created by uploading spreadsheets to define columns and data types. Data tables can be updated interactively or through subsequent spreadsheet uploads. Since scientists use spreadsheets extensively in their work, DEEDS data tables interoperate seamlessly with spreadsheets -- both for upload to DEEDS (to create, update and preserve data for interactive searchable presentation) and for download from DEEDS.
We established standards for consistency in metadata across EcoTox datasets that encompassed naming conventions for data table column labels, descriptions, data typing, as well as representations for "not applicable / not available" values and data visibility. |

| Additional metdata standards were established for customized data viewing, which enhanced the end user experience when filtering, searching and navigating large data tables. |
|
Due to the nature of our study and the associated experimental constraints, our data structure is quite complex. A key element of our work on DEEDS has been the ability to add and adjust functionalities in an adaptive and iterative fashion, as new needs arose or became apparent.
|

| A key realization as we addressed repeated measures (defined here as instances where the same measures were quantified at multiple time points, which occurred for both phenotypic and chemical data) was that independently creating tables for multiple sampling dates containing data of the same formats was not only inefficient, but had potential to lead to inconsistencies in the metadata recorded with these observations. Per our request, DEEDS developed a feature that allowed us to build repeated measures tables once, and then clone data format, metadata requirements, and display features to create tables for other sampling dates. This not only saved us time in data entry, but also ensured that data structure and metadata were identical across repeated measures tables. In addition, DEEDS developers were able to provide a feature that tracks when copies of tables are created and modified, to ensure traceability of any changes to data or their structure during this process. |
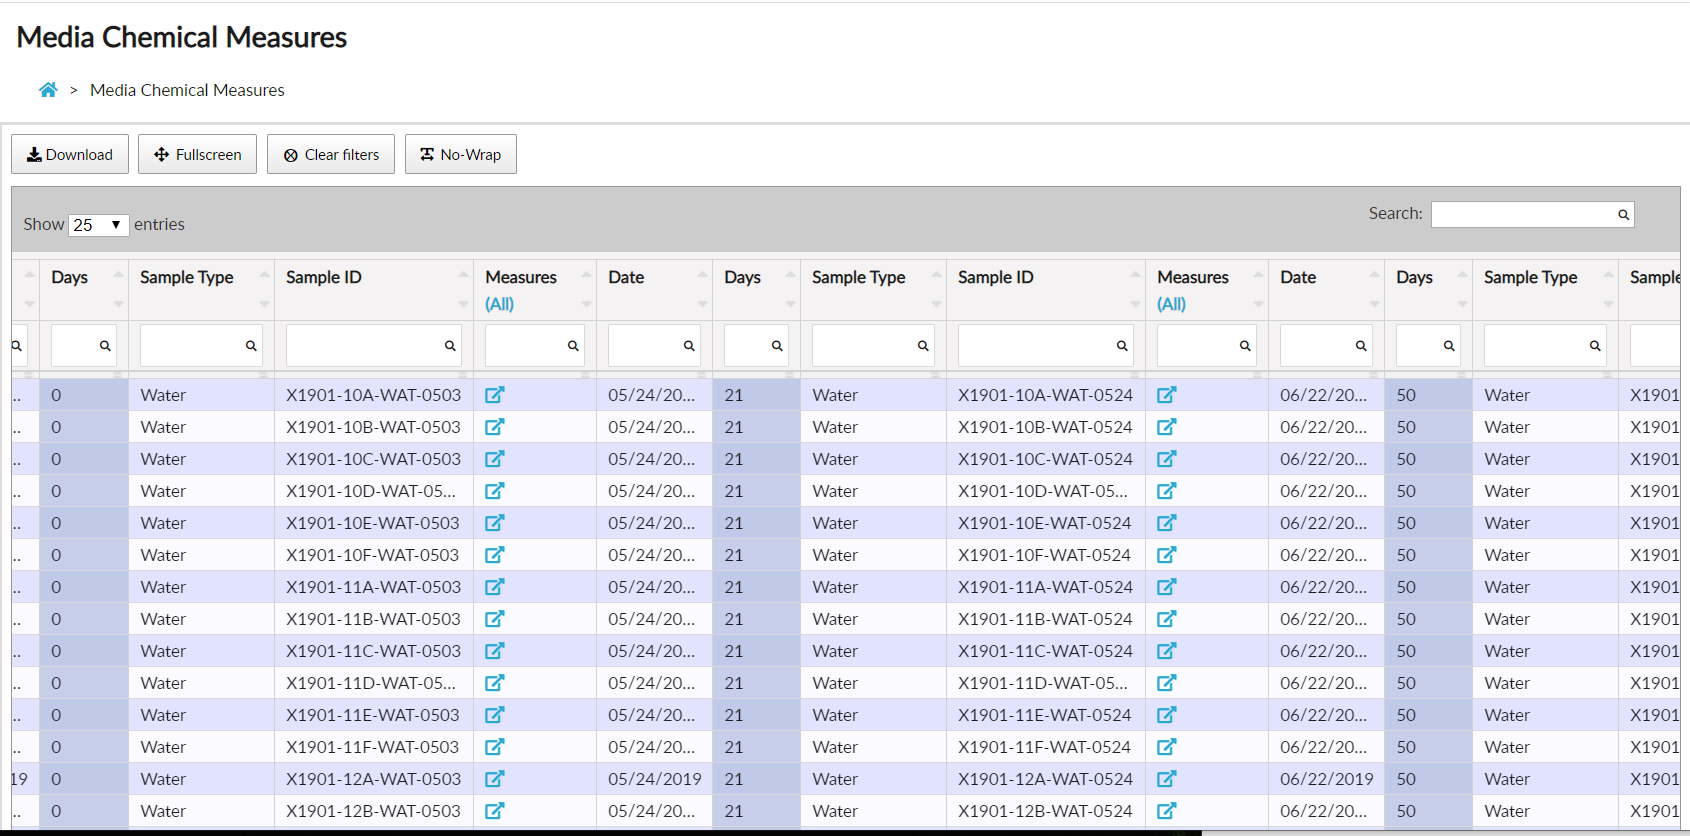
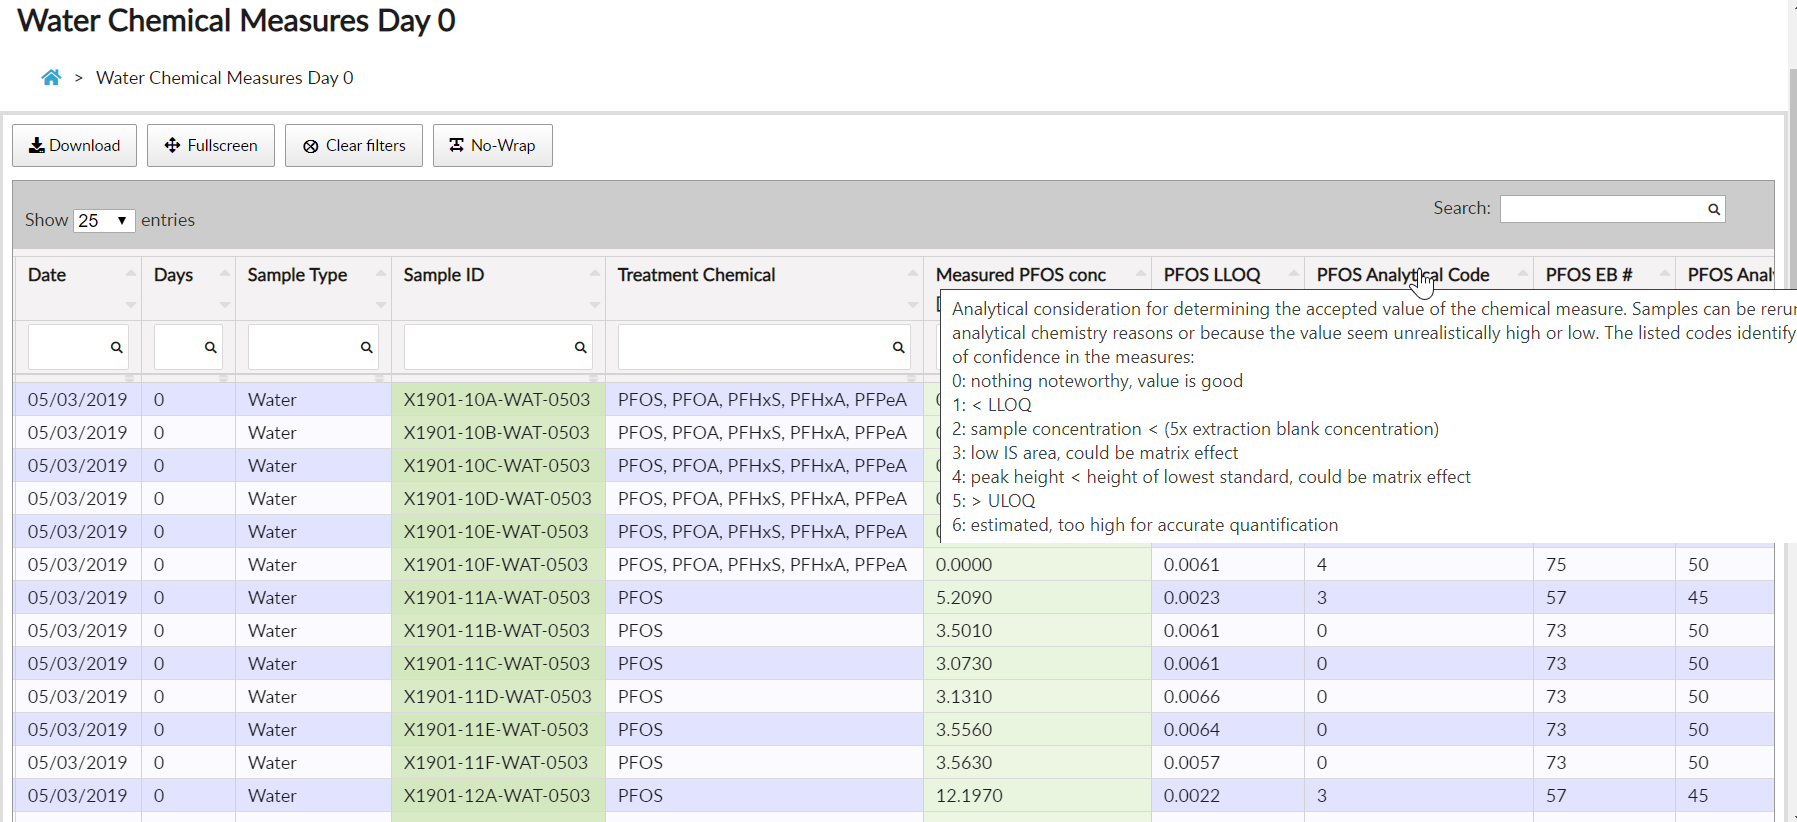
| By moving through the hierarchy of tables in DEEDS, users can easily understand how the experiment was designed. For example, we measured concentrations of the focal PFAS compounds in aquaria media on specific days, which is immediately evident from the hierarchy . It is then possible to build "drill-down" DEEDS data tables for each of these days for access to the observation level data itself. Furthermore, a file storage feature has allowed us to upload scanned raw data sheets underlying data displayed in the tables, as detailed documents describing the methods used. . |
| In short, DEEDS has enabled us to preserve and communicate a complex and hierarchical dataset, while the adaptive and collaborative approach to designing the database has led to new DEEDS functionalities that serve our needs directly. |

| Pipeline scripts available in DEEDS can transform raw data to interactive searchable DEEDS data tables. Our EcoTox datasets have pipeline scripts to transform 1) manually collected spreadsheet observations & measurements and 2) mass spectrometry instrument-generated measurements & analytical codes. Once transformed to structured DEEDS data tables, all data are are linked together for user-friendly search, exploration and viewing. Data tables provide FAIR-compliant metadata, validation, data completeness, and customized viewing. |
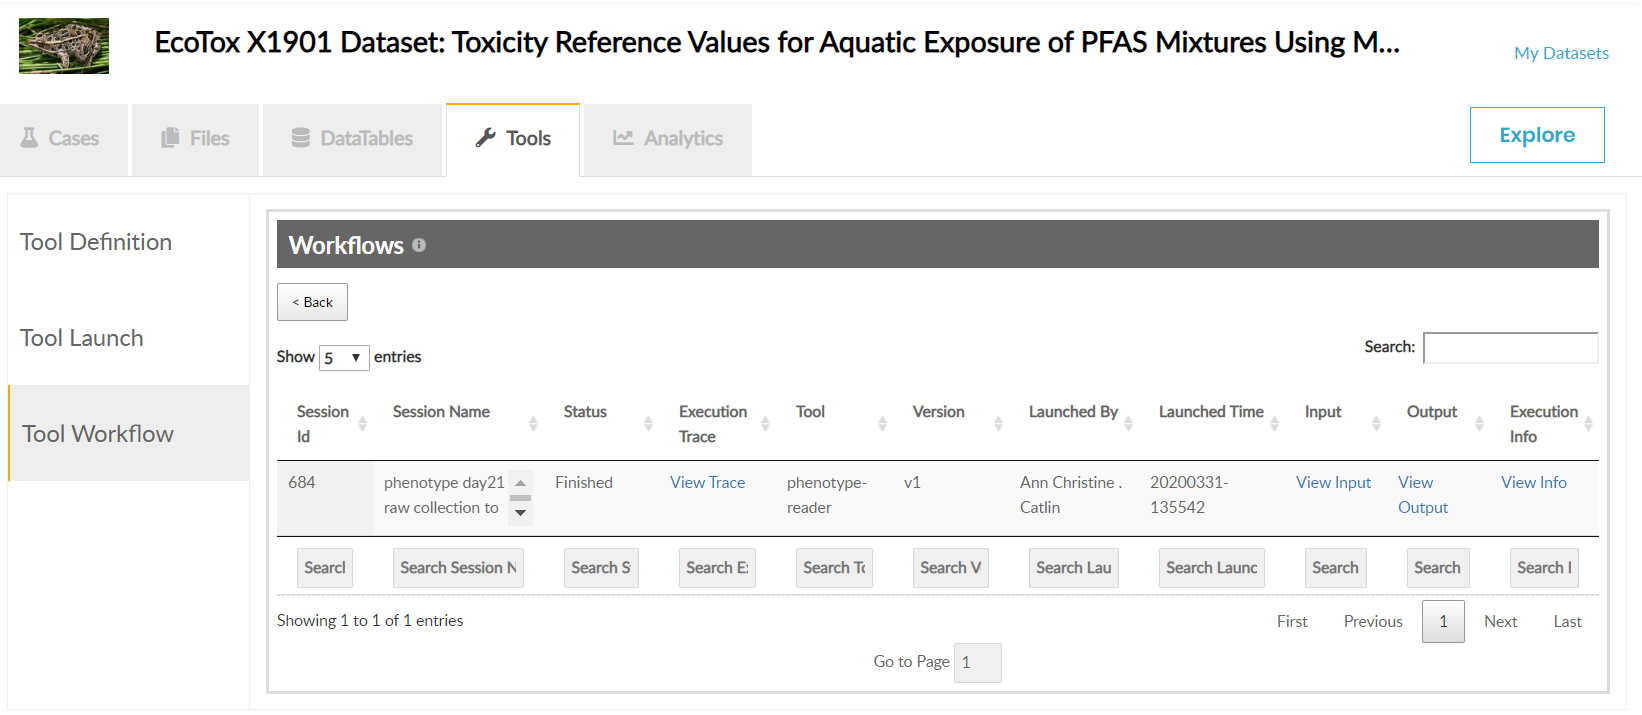
| When tools are launched and run from the DEEDS dashboard, the computing workflows (input, tool, output) are captured and preserved, and DEEDS automatically uploads tool-generated results to the dataset. Workflow metadata is available for viewing through interfaces such as View Input, View Output, and views for tracking the process of executions (which can be run on the local server or on high performance computing facilities). |
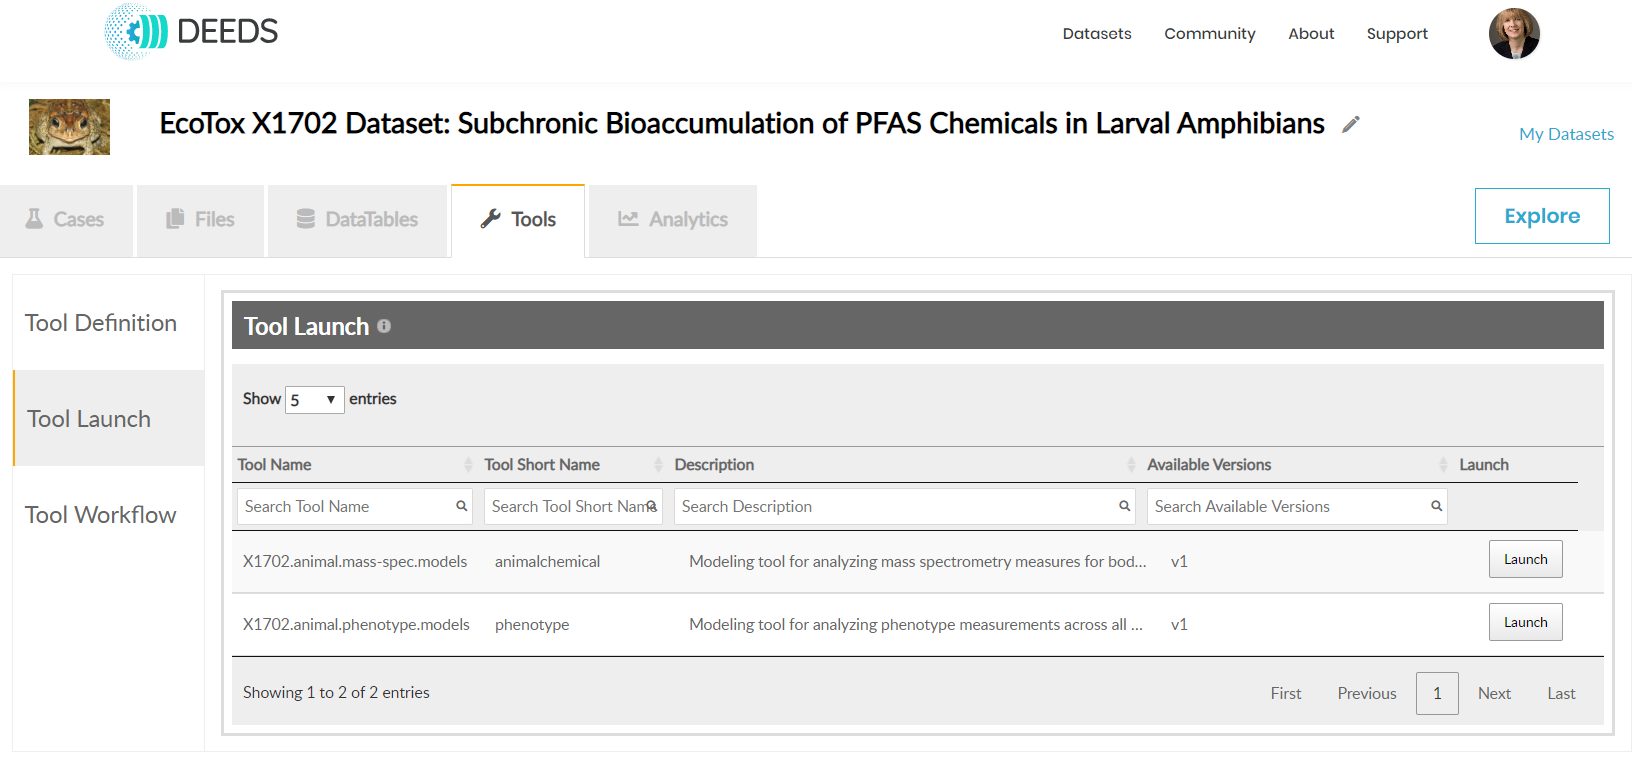
| Our dataset consists of multiple endpoints measured at both the ‘case’, or experimental unit level, and at the individual level across multiple sampling dates. Our primary objective is to assess whether PFAS chemical treatments result in effects on the size (mass and snout-vent length), developmental stage, and bioaccumulation of PFAS (body burden). All analysis is conducted using R scripts and easily integrated into DEEDS Tools. DEEDS Tools allow us to maintain the original data structure, while providing the exact R-code and data used to calculate derived values. Together, Tools ensure our results are repeatable and transparent for others to easily assess how we determined effects. |
| After we wrote and validated R codes for analyzing our data, DEEDS generalized and configured these codes to run from the dashboard, with direct linkage to our data tables for input to the analyses. Ultimately, DEEDS provides publicly accessible tools that replicate analyses presented in publications and other work. DEEDS provides a point-and-click interface where any of the analyses we conducted can be recreated without downloading datasets to local disks or implementing the code. We see this as a major innovation relative to current practices, which often include publication of underlying statistical codes and/or raw data files in more traditional, static databases (e.g., supplemental sections of published manuscripts or open access databases). DEEDS functionality will also facilitate future analyses we conduct by allowing us to proceed through the entire process of data selection, analysis, and reporting without the need for downloaded data files or implementation of R code outside of the DEEDS environment, thus providing data provenance and results traceability. |

|
Creating effective visual representations of our data is essential to the success of the project, as such figures are ideal for presenting summaries of results. Figures are generated by our R analysis tools, using the R-package ggplot2.
Providing open access to our data and code allows others to see exactly what data went into each figure and facilitates sharing and learning by others who may want to construct similar plots in their study. By using the open access package R, any person with access to a computer can use the resources we provide. Further, because DEEDS provides code execution through a point and click interface, users can also access and run the code directly within DEEDS, without downloading data or implementing R code externally. |

|
Analytics is an R-based environment where we can create data frames from DEEDS data tables and/or CSV files from the Files repository. Data frames provide detailed summary statistics on any column of data, and data filters can be applied on any column before statistics are displayed. Statistics and graphical representations of the statistics can be generated for both categorical and numeric data. Uses can generate plots (e.g., scatter, line, box and whiskers) by selecting data columns and plot options -- the plots use data frames as input. Data table operations include merge, pivot, bind and transpose. R functions such as regression analysis can be applied to data frame plots.
The DEEDS platform provides integrated data and computing services to help us preserve, manage and share our work—with collaborators during the research investigations and with global communities after publication. |
References
[1] Catlin AC, HewaNadungodage C, Clark S, Fernando S, Wickramaarachchi G, Bejarano A, Desigavinayagam P, Patil O, “Fully Integrating Data with Compute Workflows: A Platform to Better Serve Scientific Research,” The 13th Gateway Computing Environments, University of Texas at Austin, 2018.[2] Catlin AC, HewaNadungodage C, Bejarano A, “Lifecycle Support for Scientific Investigations: Integrating Data, Computing, and Workflows,” Comput. Sci. Eng. Special Issue: Scientific Workflows. July/August 2019 doi: 10.1109/MCSE.2019.2901433
[3] C. HewaNadungodage , Catlin AC, Bejarano A, “The DEEDS platform: Support for integrated data and computing across the research lifecycle,” Futur. Gener. Comput. Syst., Nov. 2019.
[4] Sepulveda MS. [Online] Available at https://www.serdp-estcp.org/index.php//Program-Areas/Environmental-Restoration/Contaminated-Groundwater/Emerging-Issues/ER-2626