NEES: The Shear Wave Velocity Profiles Database
Licensed under
Category
Published on
Abstract
Authors
The author of this database is NEES @ UTexas. The database was published at NEEShub on January 10 2011 and has been reproduced here to preserve the data and ensure continued access.
Database
doi: 10.4231/D3JH3D27N
|
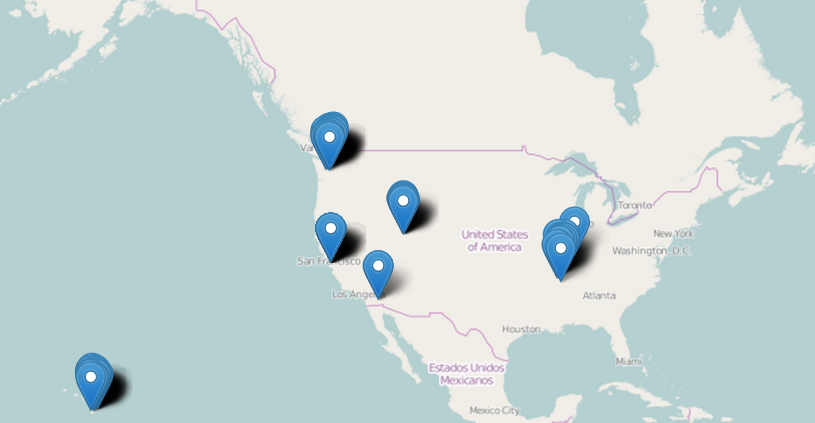
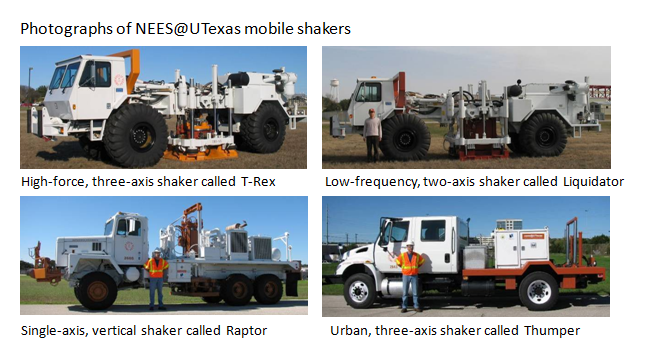
Shear wave velocity (Vs) profiles are needed for site response analyses and liquefaction susceptibility assessments. This database is a collection of Vs profiles fromfrom both NEES and non-NEES projects. Shear wave profiles are often determined via in-situ methods such as cross-hole testing, downhole testing, suspension logging testing, and active and passive surface wave testing. With large mobile shakers available at the NEES@UTexas Equipment Site, shear wave velocity can be measured to a great depth using both downhole and active surface wave methods. |
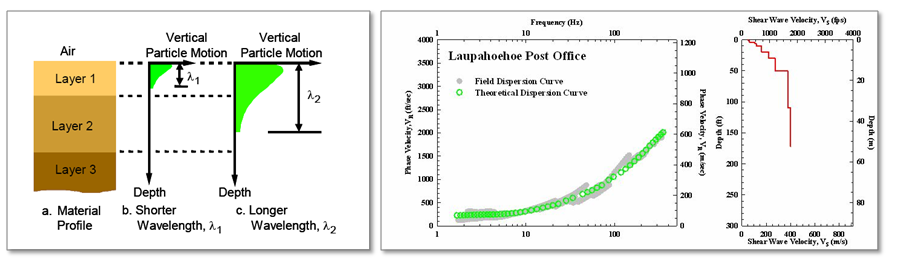
 The majority of Vs profiles available in this database were measured using the Spectral-Analysis-of-Surface-Waves (SASW) method. The SASW method is a well established active source surface wave measurement that utilizes Rayleigh waves to determine shear wave velocity profiles. The basis for the SASW method is the dispersive characteristic of Rayleigh waves when they are propagating in a layered system (i.e. soil or rock layers). Dispersion is the variation of velocity with frequency and it arises when waves of different wavelengths travel through different layers of the subsurface. High-frequency (short wavelength) waves propagate only through near-surface materials. Lower-frequency waves with longer wavelengths propagate through the near-surface as well as deeper soils.
The SASW testing involves generating surface waves with a vertical excitation and then measuring the vertical surface motions. Receivers are arranged in a straight line which stretches outward from the source. The variation in phase shift with frequency for surface waves propagating between adjacent receivers is recorded for each receiver spacing. From each receiver pair, the phase velocity of the surface wave can be calculated. The phase velocity, VR, depends primarily on the material properties (shear wave velocity, mass density, and Poisson's ratio or compression wave velocity) over a depth of approximately one wavelength. From this calculation, a plot of phase velocity versus frequency, called a dispersion curve, is generated. This procedure is repeated for all source-receiver spacings used at the site and usually involves significant overlapping in the dispersion data between adjacent receiver sets.
|
The individual dispersion curves from all receiver spacings are combined into a single composite dispersion curve called the experimental or field dispersion curve. A forward-modeling procedure is then used to match the field dispersion curve with a one-dimensional layered system of varying layer stiffnesses and thicknesses. The shear wave velocity profile that generates a dispersion curve that most closely matches the field dispersion curve is then presented as the shear wave velocity profile for the site.
Cite this work
Researchers should cite this work as follows: